

R Shiny, an open-source R package, empowers users to develop dynamic web applications for data analysis and visualization. Leveraging R’s statistical and graphical capabilities, Shiny creates customizable interfaces, enabling the creation of dashboards, data-driven tools, and interactive reports. Its seamless integration with R’s analytical prowess allows users to transform scripts into interactive dashboards and reports. Shiny democratizes access to data insights, breaking down barriers to analytical tools and enabling users of all skill levels to explore data meaningfully. Serving as a bridge between R’s statistical computing and web applications, Shiny facilitates intuitive data visualization, empowering users to unlock their data’s full potential.


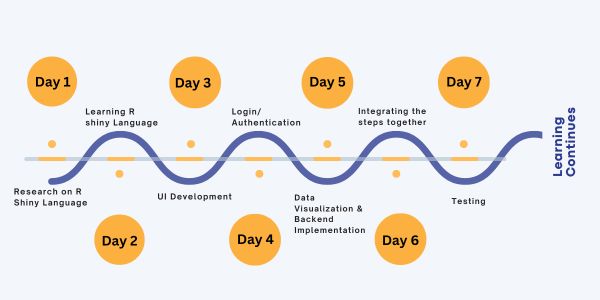
Testing:
Finally, we conducted comprehensive testing of the application to validate its functionality, responsiveness, and user experience. Through rigorous testing, we addressed any bugs or performance issues, ensuring a smooth and seamless user experience.
By meticulously following these steps, we successfully developed a proof of concept using R Shiny, demonstrating its effectiveness in creating interactive web applications for data visualization and analysis.
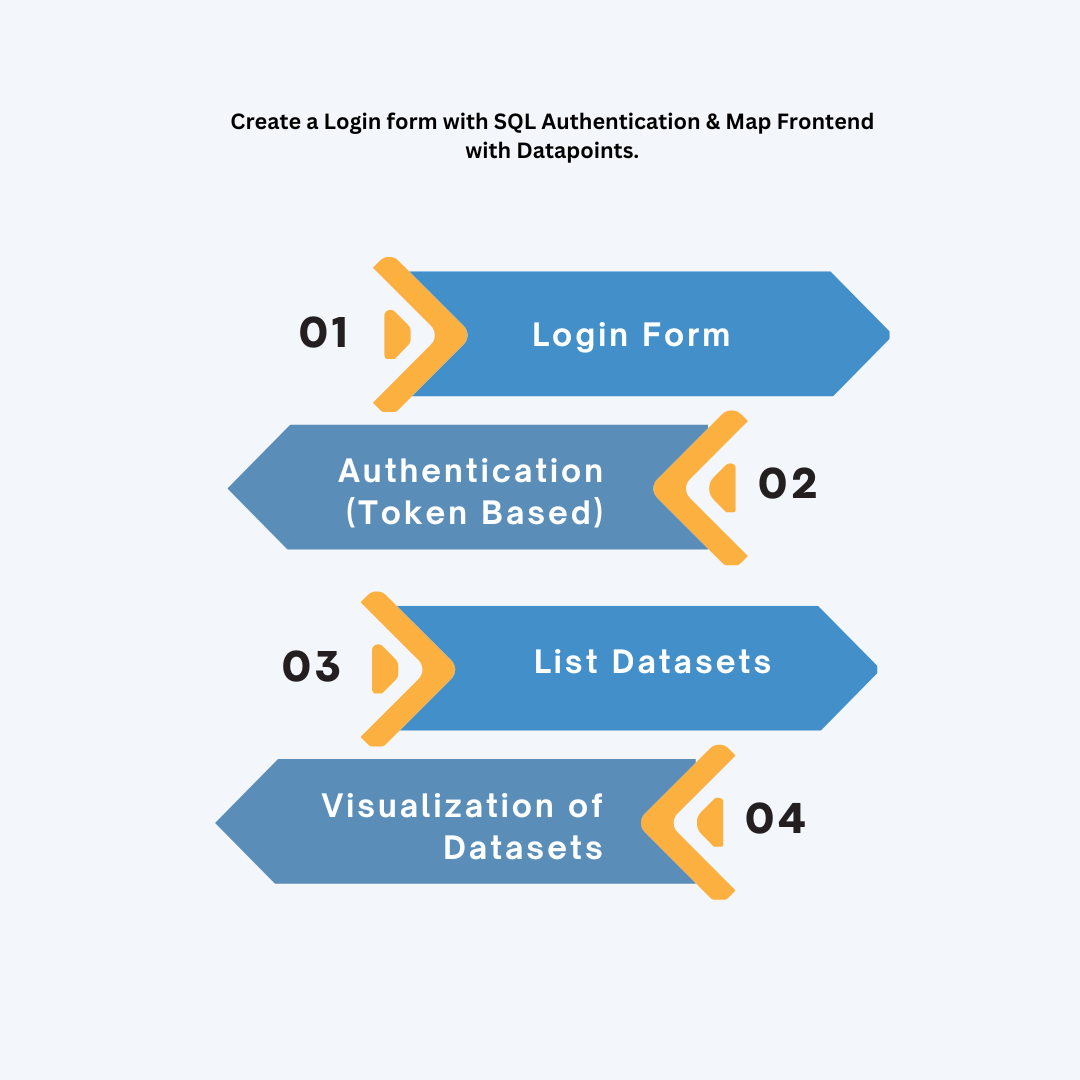
In our R Shiny proof of concept development, we utilized a diverse range of libraries to construct a robust and dynamic application. Leveraging tools like shiny, shiny.router, and shinyjs, we engineered a seamless login form with token-based authentication for secure user access. Our Dashboard UI was enriched with interactive visualizations using leaflet, plotly, and ggplot2, empowering users with deeper data exploration capabilities. Additionally, by employing RPostgreSQL, readr, and dbplyr, we enabled users to access and analyze datasets efficiently, streamlining data management tasks. Through the integration of these libraries, our proof of concept showcased the versatility and efficacy of R Shiny in crafting sophisticated and user-friendly applications tailored for data analysis and visualization.
R Shiny offers several benefits for data visualization and analytics projects. Firstly, it provides a seamless integration of R’s powerful statistical and graphical capabilities into interactive web applications, enabling users to create dynamic visualizations with minimal coding knowledge. This empowers businesses to develop customized dashboards, reports, and tools tailored to their specific needs.
Moreover, R Shiny facilitates real-time data analysis and visualization, allowing businesses to make informed decisions quickly based on the latest insights. For example, companies can build interactive dashboards to monitor key performance indicators (KPIs) in real-time, enabling timely adjustments to strategies and tactics.
Additionally, R Shiny enhances collaboration and communication by enabling stakeholders to interact with data directly, fostering a deeper understanding of complex datasets and facilitating data-driven decision-making across departments and teams. Overall, R Shiny adds significant value to businesses by democratizing access to data insights and empowering users to extract actionable intelligence from their data.
https://shiny.posit.co/r/getstarted/shiny-basics/lesson1/index.html
https://mastering-shiny.org/basic-app.html
https://www.geeksforgeeks.org/shiny-package-in-r-programming/
https://rstudio.github.io/shinydashboard/get_started.html